How to Calculate Position Size
Calculate position size for stocks, crypto, and forex using a simple 4-step formula. Protect capital with verified mathematical risk management.
AI chart scanner · For educational use
AI chart pattern recognition, key technical levels, and educational trade plans. Multimodal AI scans your price action to deliver structured breakdowns in seconds, paired with interactive follow-up chat.
Available on Android now · iPhone and web coming soon · Educational tool, not financial advice
Analyze charts from every major market
TradeVela AI scans candlestick price action, horizontal key levels, chart patterns, and momentum context to help you learn how to read markets objectively. It is built to elevate your market literacy—not to tell you what to trade.
Take a photo of your trading screen or upload a chart screenshot from your gallery across any major market and timeframe.
Tailor the technical perspective to your timeframe—whether you practice Scalping, Day Trading, Swing Trading, or Position Trading.
Go beyond static annotations. Ask the AI assistant about trend validity, indicator confluence, and alternative breakout scenarios.
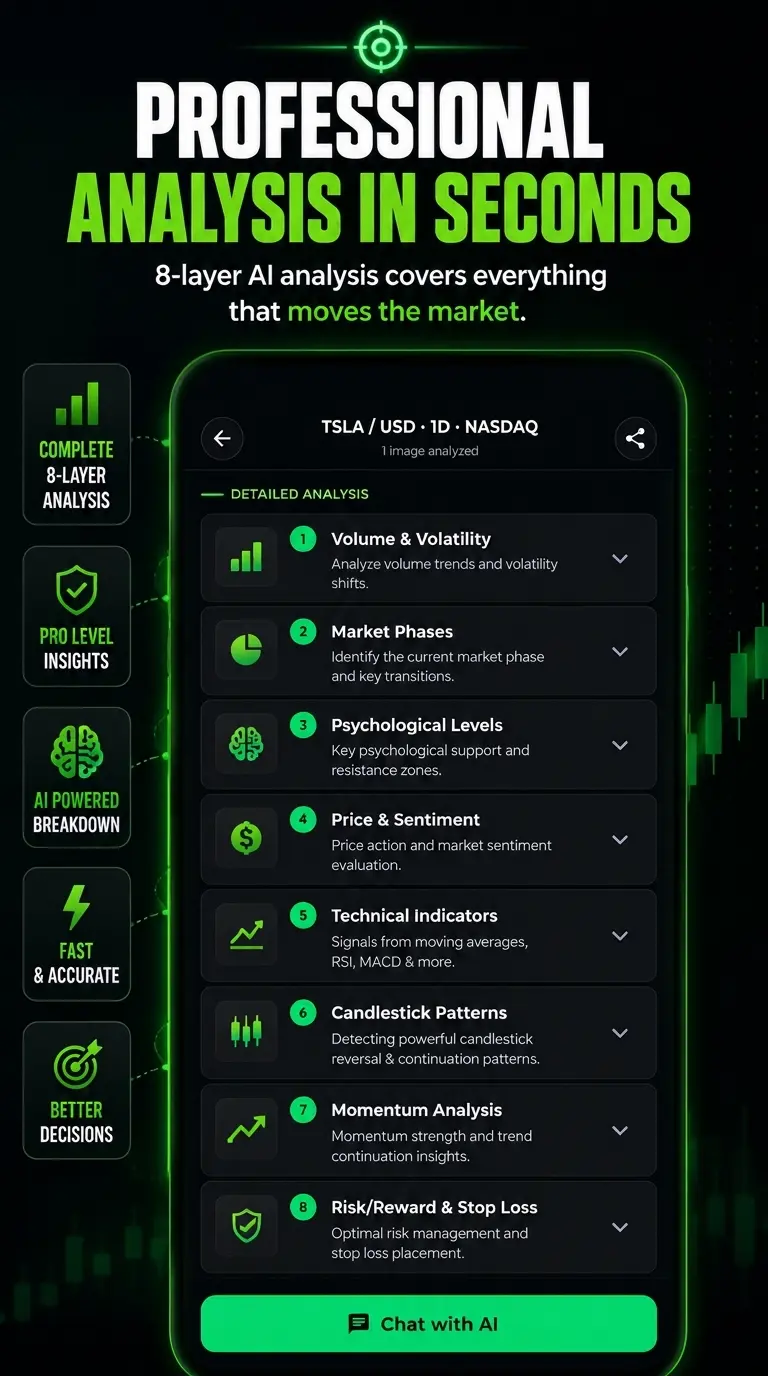
01 · PATTERN RECOGNITION
Multimodal AI scans raw price action and generates a structured technical breakdown, identifying chart patterns, trendlines, consolidation zones, and candlestick formations in seconds.
02 · STRUCTURE & LEVELS
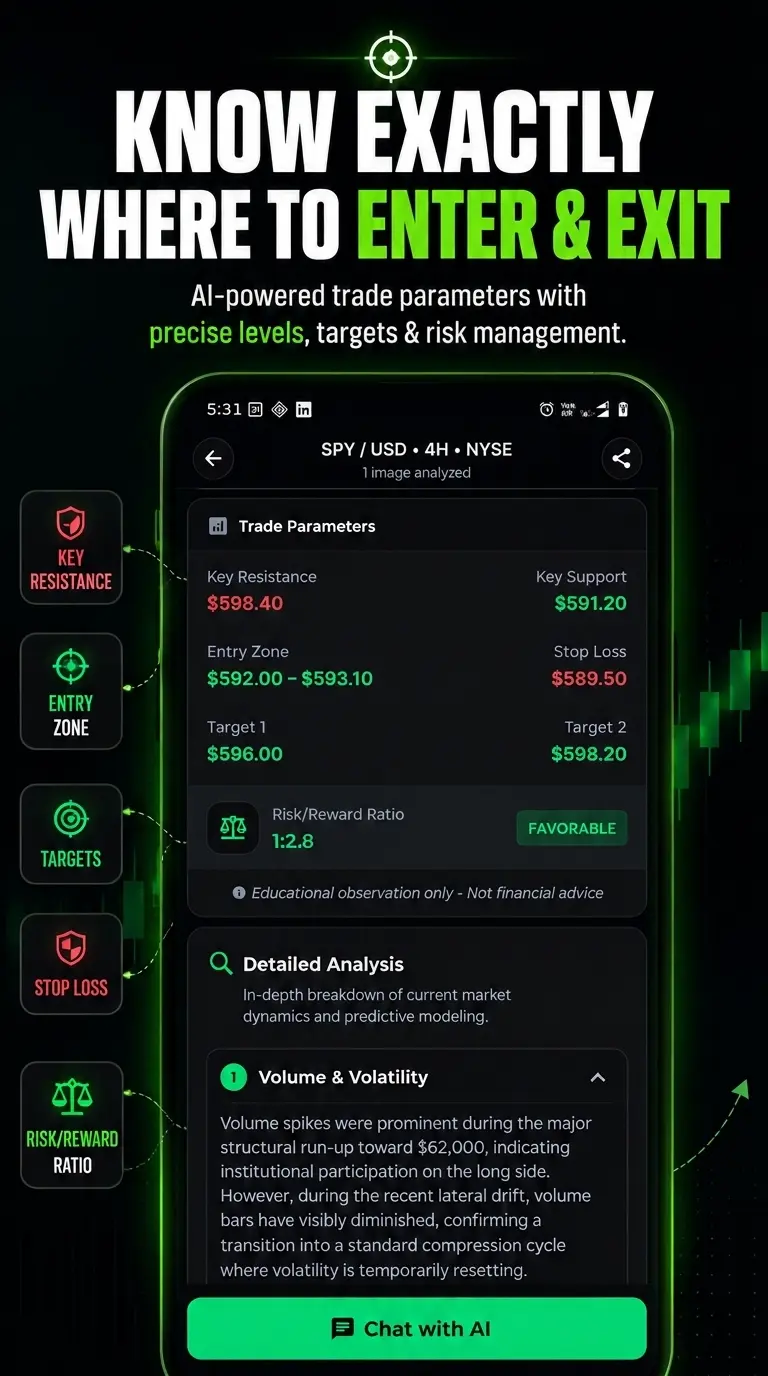
Decode critical market structure before planning a setup. TradeVela AI pinpoints key horizontal support and resistance, calculated entry zones, and structural invalidation points.
03 · RISK & MOMENTUM
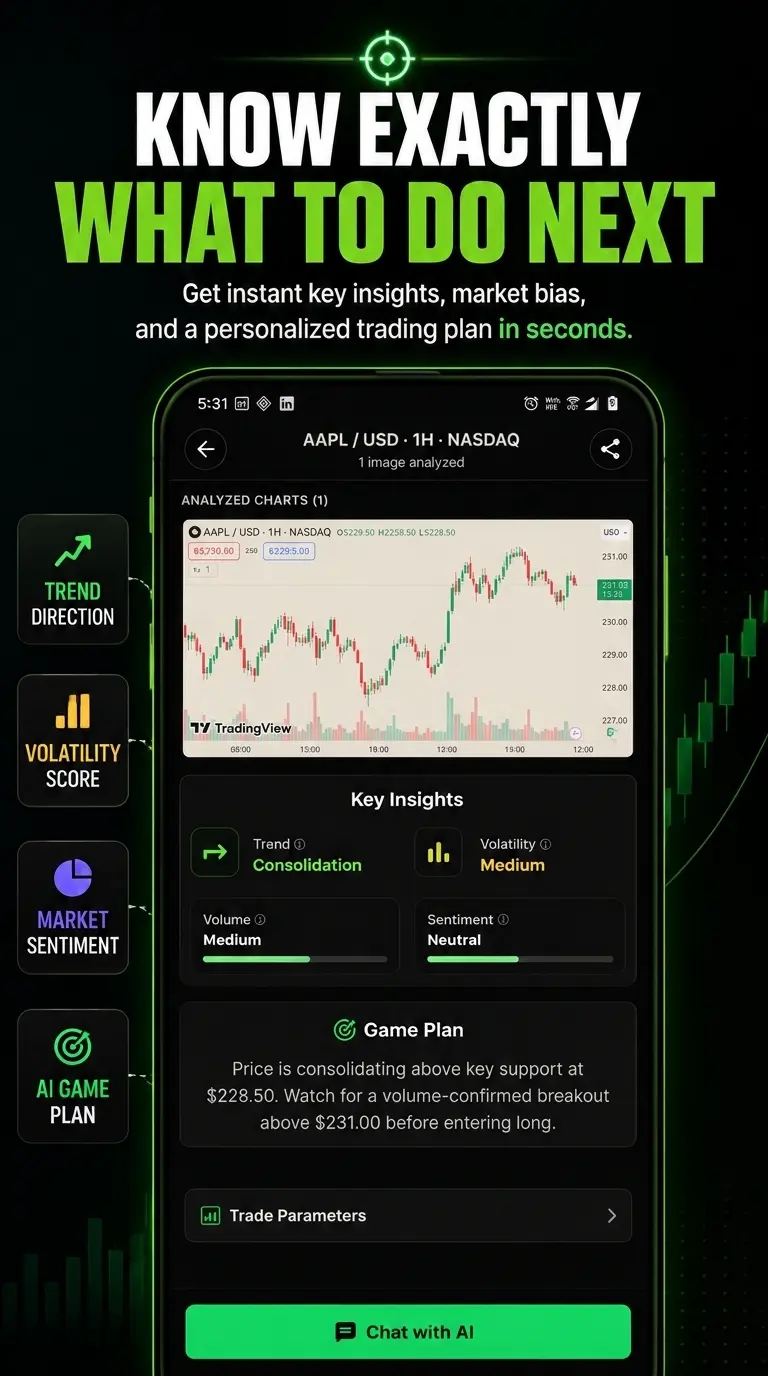
Evaluate trade setups with mathematical discipline. Analyze momentum, trend strength (Bullish, Bearish, or Sideways), and volume context to understand potential risk profiles.
04 · INTERACTIVE FOLLOW-UP
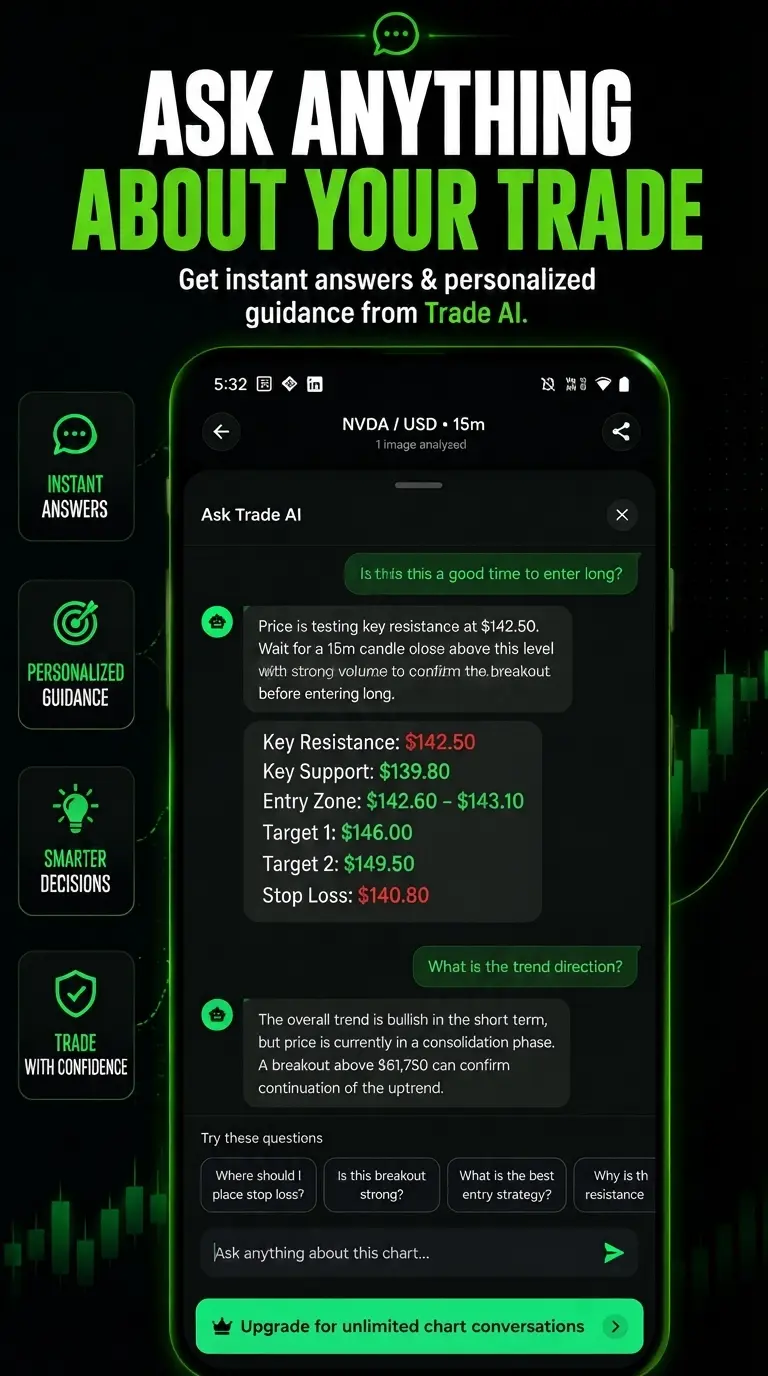
Go beyond static chart markups. Chat directly with the AI assistant to explain indicator confluence, verify pattern validity, or explore higher-timeframe context.
WORKFLOW
Four simple steps from chart photo to structured technical breakdown.
Take a photo of your trading screen or upload a chart screenshot from your gallery.
Choose your active timeframe perspective to tailor the AI analysis:
Multimodal AI scans the price action and generates a structured technical report with key levels, patterns, and risk metrics.
Chat with the AI assistant about trends, breakout confirmations, or alternative market scenarios.
WHO IT'S FOR
Build structured trading habits without getting overwhelmed.
Accelerate your routine with objective, high-speed vision AI.
COMPARISON
FREE TOOLS
Master position sizing and mathematical expectancy before risking capital.
Determine exact unit quantities or forex lots based on your account balance, risk tolerance, and stop-loss distance.
Open Position Size Calculator →Calculate risk-to-reward ratios, break-even win rates, and projected expectancy across a series of educational setups.
Open Expectancy Calculator →MEMBERSHIP
Unrestricted AI intelligence for dedicated market students.
Subscriptions are managed securely via Google Play. Cancel anytime in your Google Play account settings.
Education
Step-by-step guides on risk management, position sizing, and chart mechanics.
Calculate position size for stocks, crypto, and forex using a simple 4-step formula. Protect capital with verified mathematical risk management.
Master the math between risk-to-reward ratio and win rate. Calculate your trade expectancy with verified formulas and benchmark comparison tables.
FAQ
Everything you need to know about TradeVela AI, features, and subscriptions.
TradeVela AI is an advanced AI-powered technical analysis and educational chart scanner designed to help you decode financial markets. Upload or take a photo of any candlestick chart to receive instant pattern recognition, critical key levels, and educational trade setups across Stocks, Crypto, Forex, Commodities, and Indices.
It works in four simple steps: 1) Upload a chart screenshot or snap a photo of your screen; 2) Select your trading style (Scalping, Day Trading, Swing Trading, or Position Trading); 3) Multimodal AI analyzes the price action and generates a structured technical breakdown; 4) Chat with the AI follow-up assistant about trend validity, indicators, or alternative market scenarios.
No. TradeVela AI is strictly an educational and informational tool powered by artificial intelligence. It is not a registered financial advisor, broker-dealer, or investment analyst, and does not provide financial or trading advice. All technical levels, patterns, and AI interpretations are generated for educational and pattern-recognition study only.
TradeVela AI analyzes candlestick charts from all major financial markets, including Stocks, Cryptocurrencies, Forex (currencies), Commodities, and Indices.
TradeVela AI supports four primary trading styles: Scalping, Day Trading, Swing Trading, and Position Trading, with customizable timeframe perspectives tailored to your strategy.
TradeVela AI is currently live on Android via Google Play. Native iOS (iPhone) and web app versions are in development. You can join the notification waitlist on our website to be notified the moment they launch.
GET STARTED
Upload your first candlestick chart and explore structured AI pattern recognition today.